Closing Enterprise Deals with Salesforce Org Charts
- Posted 04/2026
- Blogs
The ups and downs of sales might make us feel like we’re starring in an action movie (I’d like to think I’d be John Wick), but enterprise deals do not just ‘die’ in one dramatic moment. I know how devastating it can be when you invest resources into enterprise deals and they fall apart at the last minute – especially if you, like me, have a habit of calculating your commission before a deal closes.
Our Salesforce data shows us contacts, deal stages, and if your salespeople are on top of things, a trail of logged activities. What we can’t see, not natively at least, is who carries real influence inside a buying group, where political resistance is building, or whether you or your team has meaningful relationships with the people who guide the purchasing decision.
86% of B2B purchases stall during the buying process, according to Forrester’s 2024 State of Business Buying report. The same research found that the average B2B purchase now involves a whopping 13 stakeholders across multiple departments. That is 13 people with different priorities, relationships and influence. I don’t know about you, but just making plans that 13 people will agree to is difficult, let alone getting them to agree and sign a contract in any reasonable timeframe!
In this article, we’ll look at how we can use a Salesforce org chart tool to capture useful information that helps us close complex enterprise deals.
What Does Your Salesforce Data Tell You About Enterprise Deals?
Open an opportunity in Salesforce and look at what you’re working with. Deal stage? Lead source? Total Contract Value? Maybe a competitor in the deal, if you’re lucky enough to know that.
Every Salesforce instance will be different; but we know the majority capture very little data that helps us close complex enterprise deals. The crucial data that wins deals often lives in your head. It’s something you ‘just know’ after building relationships for months, similar to how you know what to buy your best friend for their birthday or Christmas.
Think about it, you’ve been working a deal for six months. You know who holds the budget, you’ve built genuine relationships across the org, developed champions and influencers and even turned around would-be blockers. You understand the internal dynamics that aren’t noted down anywhere, then you go on parental leave for 6 months…
What happens to that deal?
In the best case, you hand it over to a colleague who’s already stretched across their own pipeline, their own cast of characters, their own web of internal politics to keep straight. Your six months of relationship-building gets distilled into a handover doc and a couple thirty minute calls. Good luck!
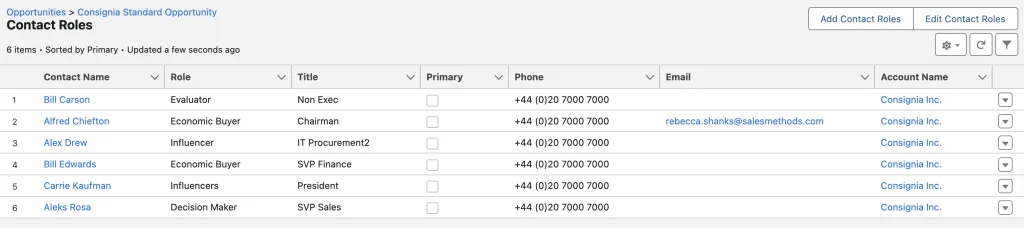
The reality is that most of this knowledge lives entirely in your head and Salesforce, for all its power, doesn’t change that. Open a standard opportunity view and you’ll get a contact list, maybe a role field. That’s it.
There’s nothing that tells your colleague that the procurement lead takes her cues from the VP of Finance even though he’s not on the deal. Nothing about the fact that your champion is brilliant but politically isolated and needs backing from someone more senior to get anything signed off. No note that the economic buyer prefers voice calls over email and once mentioned his kid plays the same sport as yours.
The small details are so important in making a conversation feel like a relationship rather than a sales call. That level of detail is what wins deals. And right now, it evaporates the moment you step away because it doesn’t live anywhere in Salesforce.
Does Your Salesforce Data Help You Close Enterprise Deals?
Think about the questions your team should be able to answer for any deal in their pipeline:
- Which key stakeholders are we focusing on?
- Where is our coverage thin?
- Who is our champion? Our economic buyer?
- What do we know about stakeholders beyond their formal title?
- Which departments are going to create friction if they’re not brought in soon?
Now think about how you’d get those answers if the salesperson wasn’t around to tell you.
Most teams can’t pull this from Salesforce because it was never captured there in the first place. As we discussed, it lives in someone’s head, and the moment that person moves on, goes on leave, or hands the deal over, the answers go with them. What you’re left with is a record of activity, not insight into the account.
Gartner found that 74% of B2B buying teams experience unhealthy conflict during the decision process, including buying team members with conflicting objectives, disagreeing on the best course of action, or being overruled by other stakeholders. That conflict is happening inside your deals right now. Whether you can see it, understand it, and do something about it depends entirely on whether you have built a picture of the account that goes beyond what standard Salesforce data captures.
This is where a Salesforce org chart tool can make a genuine difference to your deals. Instead of working from a relatively useless contact list, your team can build a visual map of the buying group directly inside the opportunity record.
Not only do you see the hierarchy, you also see things a contact list can never show, such as:
- How much influence each person carries
- Which roles you have mapped and engaged with and where you still have gaps
- How strong your team’s relationship is with each stakeholder
- Where the political lines run between them
That’s the starting point for closing enterprise deals faster, and it’s a fundamentally different foundation for working complex deals than a list of names with job titles and custom fields will allow.
How Salesforce Org Charts Help You Close Enterprise Deals
So, the question becomes: what would it look like if you could capture the relevant customer intelligence inside Salesforce, in the opportunity itself, visible to the whole team, in a way that is usable?
Mapping Your Stakeholder Coverage
You’re not going to know the whole buying group at the start of a deal, every enterprise is set up differently, and who even knows what job titles really mean these days!
OrgChartPlus’s template builder allows your salespeople to start from a framework that reflects how deals in your industry or account type typically work. The templates can be built from what you already know about how these organisations make decisions.
When you drag and drop the contacts you have, the gaps are surfaced immediately. Rather than being blindsided by a deal that falls apart at the last minute because an unknown stakeholder comes out of the woodwork just as the deal is about to be signed, you will know exactly where your gaps are from day one. A placeholder for a role you haven’t filled becomes a prompt to go and find that person and engage with them.
Spotting Gaps in Stakeholder Coverage
Enterprise deals are rarely won by one person. By the time you’re navigating a complex buying committee, you’ll typically have an account executive managing the overall relationship, a sales engineer handling technical validation, and a sales manager overseeing the process and keeping things on track. Each of them will have built different relationships with different contacts inside the account.
OrgChartPlus’s Matrix View allows you to visualize every contact in the account against every member of your sales team, showing the nature of each relationship in a single view. Instead of relying on quick Slack pings to piece together who knows who, the team can open the matrix and immediately see where coverage exists and where it doesn’t.
The practical value of this becomes obvious in a scenario most enterprise sellers will recognise. Let’s say the AE wants to get time with the Head of Procurement, but they haven’t engaged directly with them. Rather than cold outreach or an awkward escalation to someone ‘above’ them, the AE opens the matrix and sees that the sales engineer already has an established relationship with that contact from a previous technical call. Now, the sales engineer reaches out first, re-engages the conversation, and makes the introduction. That kind of coordination would usually require a meeting to surface; the matrix surfaces it in seconds.
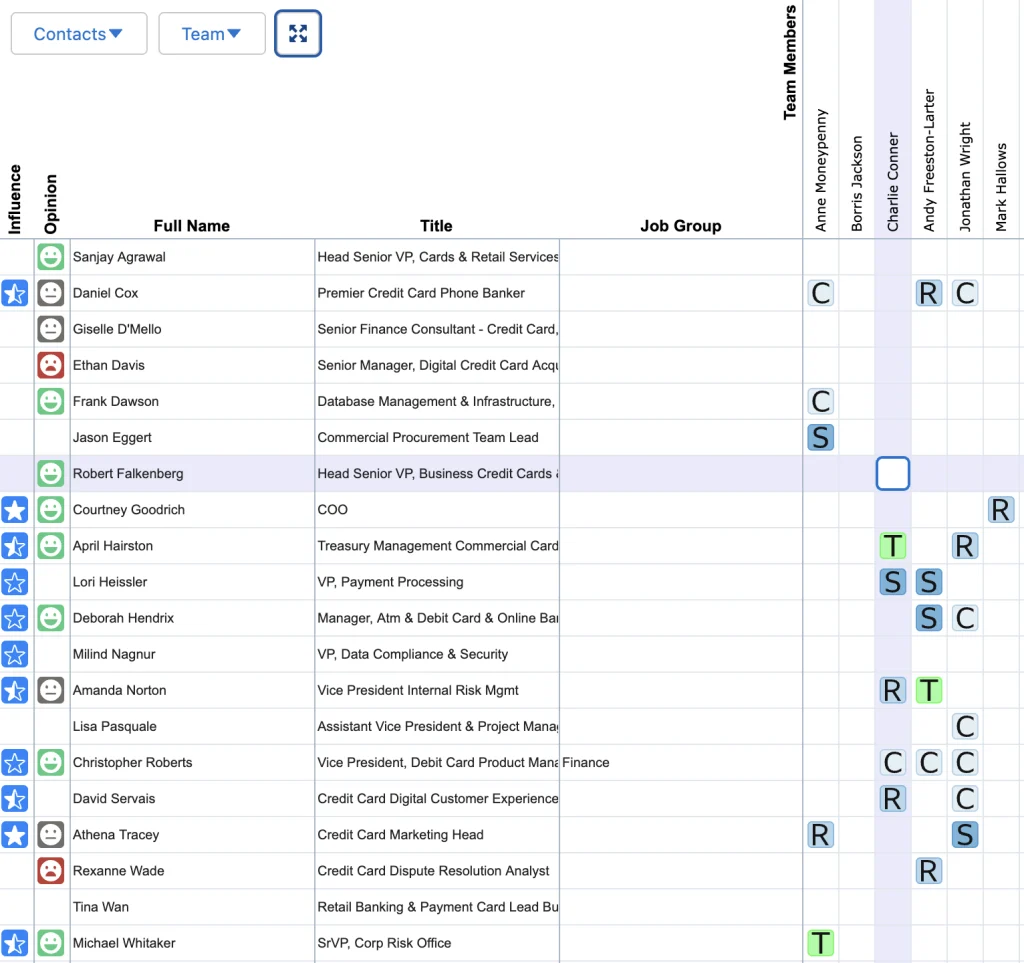
The view is equally useful for sales managers reviewing deals from above. Rather than relying on salespeople’s updates alone, a manager can open the matrix and quickly assess which key contacts are actively engaged, which are sitting untouched, and whether the right people on the team are in front of the right stakeholders. If a senior decision-maker has only been touched by one rep and that rep has a weak relationship score, the manager can see that risk before it becomes a problem.
The Matrix View gives everyone a shared, accurate picture of where relationships stand and who is best placed to move them forward. It allows you to work your deals proactively, not reactively.
Multi-Threaded Enterprise Deals
Most enterprise deals will have a ‘main contact’. Someone who is engaged and positive about what’s being proposed. I’m guilty of letting the relationship with that person become my main touchpoint without digging further, to let activity with them substitute for coverage of the broader buying group. You could get along with them really well, but if they don’t have the right influence or buying power, then it’s simply not good enough for enterprise deals.
According to UserGems’ analysis of 500 B2B opportunities, a lone wolf (a single-threaded opportunity) has a 5% chance of winning. Increase that to five people (a multi-threaded opportunity), and your chance of winning jumps to 30%, a 6X improvement.
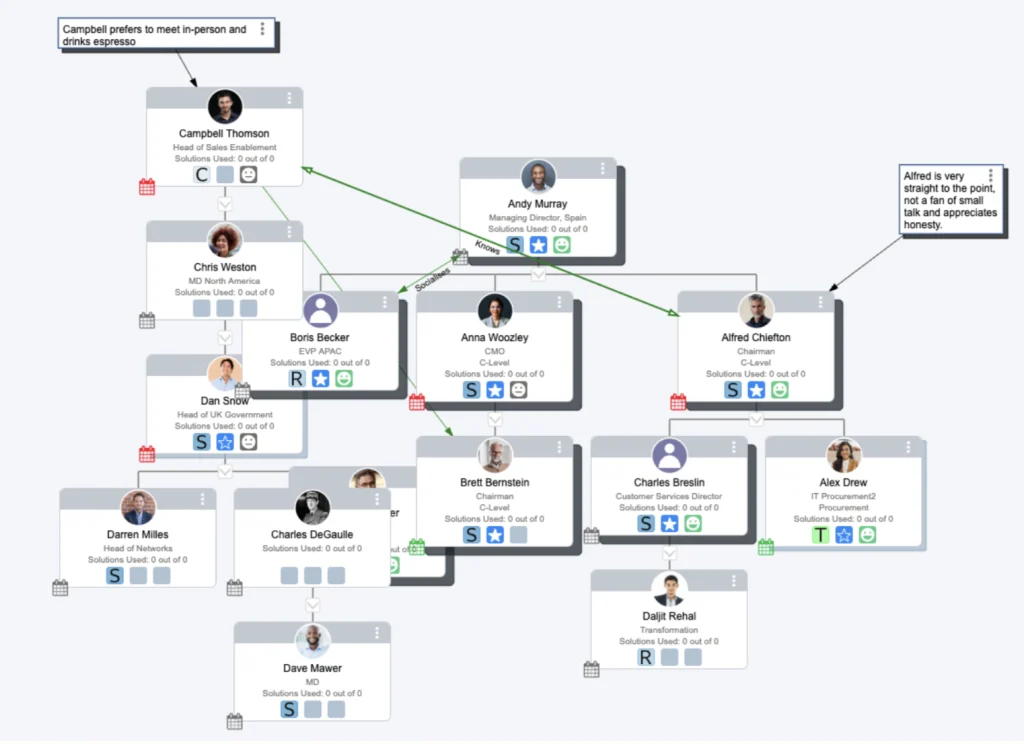
In OrgChartPlus, this is visualised directly on the org chart. Every contact carries an engagement indicator, which is customisable to how your business defines meaningful activity, so when a stakeholder hasn’t had anything logged against them in a set period, it shows up immediately. In a deal with eight contacts, you might see five of them flagged as having no recent contact, telling you clearly that the whole deal is running through one relationship while the rest of the buying group sits untouched.
That visibility removes assumptions and creates accountability. Managers can set expectations, for example, that 75% of high-influence contacts on any enterprise deal must show healthy engagement at all times, and the org chart makes it easy to see at a glance whether that standard is being met. Best practices stop being something you remind people about and start being something the team can actually see and own.
Understanding the Internal Politics
I’ve worked deals where different stakeholders have completely different understandings of what’s been agreed, requirements keep shifting, and I find myself repeating conversations I was certain we’d already closed out. Not only is it incredibly frustrating, it leaves the deal on much shakier ground than the pipeline report suggests.
Good discovery is what prevents this. When I’m mapping a buying group, I use the notes against each stakeholder to capture not just their role, but what actually matters to them. A Head of Sales once told me he wasn’t particularly concerned about price because the budget sat with someone else, but he lit up when we got into how the data could feed into Salesforce reports and dashboards. That one detail changed how I ran every subsequent conversation with him. And because it was captured on the org chart rather than in my head, anyone else who touched that deal had the same context from day one.
Emblaze’s 2024 research found that buyers change their problem statement an average of 3.2 times during complex purchases. This is because a buying group spread across multiple functions rarely holds a unified view of the problem. Different people are optimising for different outcomes, they care about different things. That misalignment plays out in the sales process, whether you can see it or not.
OrgChartPlus’s influence and opinion scoring lets you visualise it. Each contact on the chart carries a rating for how much weight their view carries inside the buying group, and a separate indicator for how they feel about your solution. When those two things are mapped together, the picture becomes very clear, very quickly. If the person with the highest influence score is neutral or negative on what you’re proposing, while the contacts your team knows best are lower-influence advocates, the internal conversation is not going the way your activity log suggests. That tells you who you need to be talking to, what you need to understand about their position, and where you need to shift your approach.
Conclusion
Pick the opportunity you’re most confident about. The one you’d put money on. Now ask yourself: if you had to hand it over tomorrow, what would actually transfer with it?
Would you still be confident it would close?
The informal politics and information salespeople learn about an account is too valuable to lose, and too useful to not capture. Getting that knowledge out of people’s heads and into Salesforce is no easy task.
If you want to see what your current pipeline looks like beyond the contact list, try OrgChartPlus free and build your first org chart today.
Please don’t hesitate to get in touch with our support team for any issues – support@salesmethods.com